According to the National Highway Traffic Safety Administration (NHTSA), an estimated 39,345 people in the United States died in traffic crashes in 2024. This represents a decrease of about 3.8% compared to the 40,901 fatalities reported in 2023 and marks the first time since 2020 that the number of fatalities fell below 40,000.
“It’s encouraging to see that traffic fatalities are continuing to fall from their COVID pandemic highs. Total road fatalities, however, remain significantly higher than a decade ago, and America’s traffic fatality rate remains high relative to many peer nations,” NHTSA Chief Counsel Peter Simshauser said.
Statistics regarding pedestrian fatality rates are promising, but there is still much work to be done to address these preventable deaths. According to the July 2025 report from the Governors Highway Safety Association (GHSA), drivers struck and killed 7,148 people walking in the United States in 2024, which is down 4.3% from the year before. Even so, pedestrian fatalities have risen more than 19% over the past eight years.
Accessing crash data plays an important role in assessing the safety needs and concerns for people walking and biking in our communities. Explore the tools and links below for accessing National and California crash data, resources, tools, and statistics.
National Resources and Tools
National Highway Traffic Safety Administration (NHTSA)
National Highway Traffic Safety Administration (NHTSA)
NHTSA provides a wide range of analytical and statistical support to the highway safety community, including the following crash data systems:
- Crash Investigation Sampling System (CISS)
- Crash Report Sampling System (CRSS)
- Fatality Analysis Reporting System (FARS)
- Fatality and Injury Reporting System Tool (FIRST)
- National Automotive Sampling System (NASS)
- National Center for Statistics and Analysis (NCSA) FARS and GES/CRSS query reporting tools and traffic safety publications
- Special Crash Investigations (SCI)
- Non-Traffic Surveillance (NTS)
National EMS Traffic Crash Dashboard
National EMS Traffic Crash Dashboard
The national EMS Traffic Crash Dashboard provides up-to-date information for EMS activations where the cause of injury was reported as motor vehicle-related across all 50 states, three territories and the District of Columbia—approximately 50 million EMS activations each year. The dashboard elements are collected using the national standard for EMS data and represent 90% of all EMS responses. Data is collected in near real time with most states reporting complete data within 8 days.
This data can be used to characterize and understand traffic incident mortality and morbidity and can also serve as a valuable tool for planning and prevention activities.
California Resources and Tools
California Crash Reporting System (CCRS)
California Crash Reporting System
The California Crash Reporting System (CCRS) is a database that collects, and processes crash records from within the State of California provided from the California Highway Patrol (CHP).
Transportation Injury Mapping System (TIMS)
Transportation Injury Mapping System (TIMS)
The Transportation Injury Mapping System (TIMS) has been developed by UC Berkeley SafeTREC's GIS Program team to provide quick, easy and free access to California crash data that has been geo-coded to make it easy to map out crashes and even view the locations in Google Street View.
The following tools are currently available on TIMS:
- SWITRS Summary
- DUI Crash Summary and Map
- Weekly Crash Trends
- SWITRS Query & Map
- SWITRS GIS Map
- California Safety Performance Measure Target Setting
- Crash Diagram
- Safe Routes to School Map
- ATP Maps & Summary Data
- Motorcycle Crash Map
| TOOL | SNAPSHOT |
|
SWITRS Summary The SWITRS Statewide Summary is a tool for accessing and mapping statewide crash and injury data from the California Statewide Integrated Traffic Records System (SWITRS). The following data can be queried and viewed in tables:
Users may query cities or counties, and may view 3 or 5 years of the most recent data available. Data is updated quarterly. |
 |
|
DUI Crash Summary and Map Explore alcohol- and drug-related crash and injury trends, both statewide and in a county or city area. |
 |
|
Weekly Crash Trends This tool can be used to visualize weekly fatal and injury crashes on state highways in California. The tool can be used to monitor the frequency and type of crashes that occur on a weekly basis for recent years. |
 |
| SWITRS Query & Map A basic tool for accessing fatal or injury crashes from the California Statewide Integrated Traffic Records System (SWITRS). |
 |
| SWITRS GIS Map The SWITRS Geographic Information Systems (GIS) Map tool offers an interactive map with the capability of multiple tasks including Rank by Intersection, Crash Diagram, etc. |
 |
|
California Safety PM Target Setting Supporting Tool The California Safety Performance Management (Safety PM) Target Setting Support Tool is based on FARS, SWITRS, and HPMS data. |
 |
|
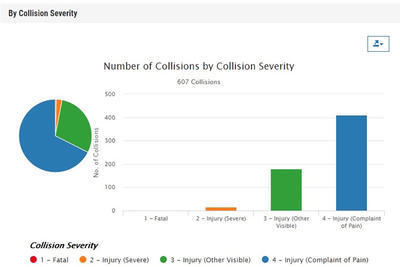
Crash Diagram The Crash Diagram tool allows users to generate an interactive crash diagram. The Crash Diagram is accessible through SWITRS GIS Map. |
 |
| Safe Routes to School (SRTS) Map The Safe Routes to School (SRTS) Map provides a pedestrian and bicycle crash map within a half mile radius of public schools in California. |
 |
|
ATP Maps & Summary Data The ATP Maps & Summary Data tool utilizes multiple crash maps to find pedestrian and bicycle crash hot spots and generates data summaries within specified project and/or community limits. |
 |
|
Motorcycle Crash Map The Motorcycle Crash Map provides a simple means to explore motorcycle crashes in California by selected county and/or city. |
 |
To use the site, simply create an account and log in using the password that will be instantly emailed to your inbox.
California Traffic Safety Dashboard
California Traffic Safety Dashboard

The California Traffic Safety Dashboard is a series of tools designed by UC Berkeley SafeTREC to allow users to visualize crash data and traffic safety activities in conjunction with demographics in California. The Traffic Safety Overview Tool consists of a series of dashboards that allow users to access both detailed crash and demographic information on the region of choice while also ranking different geographic regions by various fatality and serious injury metrics. The Safety Heat Map allows for a more detailed analysis by creating interactive heat maps utilizing crash and demographic data as well as traffic safety improvement activities in California. Finally, the OTS Grants Clearinghouse serves as a platform where California Office of Traffic Safety (OTS) officials and grantees can access historical grant data.
The following Tools are currently available:
-
Traffic Safety Overview
-
Safety Heat Map
-
OTS Grants Clearinghouse
California Office of Traffic Safety (OTS) Crash Rankings
California Office of Traffic Safety (OTS)
OTS Crash Rankings
The California Office of Traffic Safety (OTS) Crash Rankings were developed so that individual cities could compare their city’s traffic safety statistics to those of other cities with similar-sized populations. Cities could use these comparisons to see what areas they may have problems in and which they were doing well in. The results helped both cities and OTS identify emerging or on-going traffic safety problem areas in order to help plan how to combat the problems and help with the possibility of facilitating grants. In recent years, media, researchers and the public have taken an interest in the OTS Rankings. It should be noted that OTS rankings are only indicators of potential problems; there are many factors that may either understate or overstate a city/county ranking that must be evaluated based on local circumstances.
OTS Data and Statistics Resources
- California Traffic Safety Quick Stats (Fast Facts)
- California Fatality and Injury Statistics (SWITRS)
- National Traffic Research and Analysis (NCSA)
- California Department of Motor Research Studies and Reports
- California Demographic, Economic, and Financial Research (DOF)
- National Transportation Statistics
- California Office of Traffic Safety (OTS) Traffic Safety Resources
California Strategic Highway Safety Plan (SHSP) Crash Data Dashboard
California Strategic Highway Safety Plan (SHSP) Crash Data Dashboard
Caltrans has developed the California SHSP Crash Data Dashboard to provide SHSP implementers with direct access to crash data. The dashboard allows for filtering of the number and characteristics of fatal and serious injury crashes over the last 10 years. Some filtering options include:
- SHSP Challenge Area

- Crash Severity
- Location: District, County, Metropolitan Planning Organization (MPO), and City
- Crash Cause
- Crash Time
- Crash Party and Victim Demographics
NEW:
- As of Spring 2023, provisional data, also known as unfinalized data, is now available in the SHSP Crash Data Dashboard. This is meant to provide traffic safety stakeholders access to crash data sooner than has been traditionally available. Learn more in the Spring 2023 SHSP E-Newsletter.
- In the Spring 2022 SHSP E-Newsletter, Caltrans noted that in coordination with the Native American Advisory Committee (NAAC) and through geocoding efforts of University of California Berkeley SafeTREC, a filter was added to the tabs of the SHSP Crash Data Dashboard to allow all data to be filtered by whether a fatal or serious injury crash was within 5 miles of a tribal boundary.
Learn more about the Strategic Highway Safety Plan and the SHSP Crash Data Dashboard.
Street Story
Street Story
Street Story is a community engagement platform provided by UC Berkeley SafeTREC in English and Spanish that allows residents, community groups, and agencies to collect information about transportation crashes, near misses, general hazards, and safe locations to travel. The tool is free to use, anonymous, and publicly accessible. Street Story is not a substitute for reporting crashes to the police.
Overview of Street Story features
| Features | Snapshot |
|
Street Story platform Available in English and Spanish, the Street Story reporting platform allows the public to input information including narratives about transportation crashes, near-misses, general hazards and safe locations to travel throughout California. |
 The Street Story Reports feature displays a Report Map that indicates the location of submissions and provides data summaries, charts, and graphs. It also displays a new toggle button to compare travel experiences shared by community members and residents to fatal and serious injury crash data that has been collected by the California Highway Patrol. |
|
Street Story Reports Available in English and Spanish, Street Story Reports is a feature that provides summaries, charts and graphs about the information that has been collected. It provides a Report Map that indicates the locations of submissions throughout California. Reports can also be filtered by date and provide demographic information of respondents. NEW - Street Story Reports now displays a toggle button that allows users to view crowdsourced transportation data from the platform alongside statewide crash data from the Statewide Integrated Traffic Records System (SWITRS). |
 The Street Story Reports feature displays a Report Map that indicates the location of submissions and provides data summaries, charts, and graphs. It also displays a new toggle button to compare travel experiences shared by community members and residents to fatal and serious injury crash data that has been collected by the California Highway Patrol. |
|
Street Story Custom Boundary Available in English and Spanish, the Street Story Custom Boundary feature allows community members and agencies to create and share their own interest area. They can do so by drawing or uploading their own boundary using the drawing tool on the map, or by uploading a shapefile. More information about this feature can be found in the Street Story Custom Boundary Instructions (available in English and Spanish). |
 The Street Story Custom Boundary feature allows community members and agencies to create and share their own interest area. |
Autonomous Vehicles (AV) Safety Dashboard
Autonomous Vehicles (AV) Safety Dashboard
The Autonomous Vehicles (AV) Safety Dashboard is SafeTREC's newest tool that allows users to visualize AV crashes and mileage data across California. It is important to note that currently only data reported by AV manufacturers through the AV Testing and AV Driverless Testing Permits to the department of California Department of Motor Vehicles (DMV) are used in the tool.
The following tools are currently available:
-
AV Crash Dashboard: This dashboard summarizes trends in crashes, maps each crash, and provides details on the individual crashes.
-
AV Mileage Dashboard: This dashboard shows summary statistics for miles traveled over time for all manufacturers with the option to filter for individual manufacturers.
Additional Resources
- Fatality Facts, State by state (IIHS)
- Annual Crash Data on California State Highways (Caltrans)
- Crash Analysis Studio (Strong Towns)